With time-proven reliability and stability of vibrating wire sensor technology


Overview
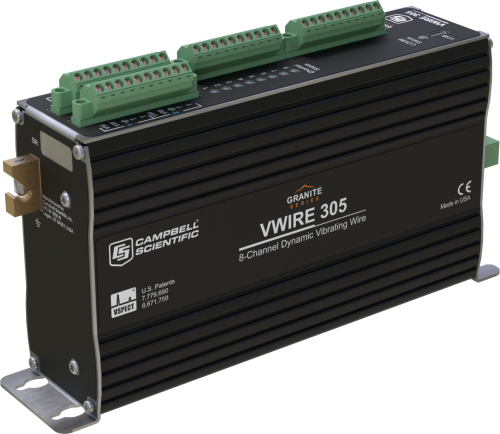
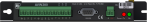
The Granite™ VWire 305 is an eight-channel interface for dynamic measurements of standard vibrating wire sensors. With the VWire 305 interface, you can operate any standard vibrating wire sensor at “dynamic” rates to achieve faster and better measurements without having to purchase or install new sensors.
The interface measures the resonant frequency of the wire between excitations using the patented vibrating wire spectral-analysis technology (VSPECT™). VSPECT provides very fine measurement resolution and limits the influence of external noise by discriminating between signal and noise based on frequency content. Because of this technology, the signal can be carried through longer cables in harsher noise environments, giving you flexibility in your sensor and data acquisition system siting, while providing sensor diagnostics never available before.
Learn about our patented VSPECT spectral-analysis technology at our VSPECT Essentials web resource.
Learn about dynamic vibrating wire sensor measurements at our Dynamic Vibrating Wire web resource.
The dynamic vibrating wire measurement technique is protected under U.S. Patent No. 8,671,758, and the vibrating wire spectral-analysis technology (VSPECT) is protected under U.S. Patent No. 7,779,690.
Read MoreBenefits and Features
- Dedicated measurement hardware for simultaneous measurement of each channel
- Interfaces to any standard vibrating wire sensor
- Eight simultaneously sampled channels per module; synchronized across multiple modules
- Dynamic measurement rates of 20 to 333 Hz
- Static measurement vibrating wire and thermistor measurements at 1 Hz
- VSPECT spectral interpolation algorithms provide superior noise immunity and measurement resolution compared to time-domain period-averaging approach
- Excitation method providing frequent low-energy pulses to maintain a continuous resonant vibration in the sensor
- Onboard post-processing including frequency conversion, temperature conversion, and rainflow histogram calculation
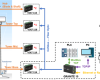
- CPI DAQ connection for channel expansion
- USB 2.0 interface for PC-based operation
Images


Detailed Description
In addition to the dynamic vibrating wire measurement, the VWire 305 makes several auxiliary measurements. A static vibrating wire measurement is made once each second, along with the dynamic measurements, which provides finer measurement resolution and greater immunity to external noise sources. The VWire 305 includes a thermistor input channel paired with each vibrating wire channel, featuring high-precision 24-bit measurements at a 1 Hz rate. Unique to the VSPECT technology, a rich set of diagnostic parameters is provided with the vibrating wire data.
The VWire 305 has the capability to simplify post-processing of data by computing common values internally. Vibrating wire data can be reported as measured frequency or as the frequency squared with a multiplier and offset applied. The thermistor data is reported as resistance or is converted to degrees Celsius using the thermistor’s Steinhart-Hart coefficients. The VWire 305 can also internally compile rainflow histograms from the final data and report the values at user-specified intervals.
Vibrating Wire Inputs
Each channel has two terminals for connecting to the coil of the vibrating wire sensor. Both vibrating wire terminals are labeled VW, and the polarity of the wiring is arbitrary. The sensor is excited and measured through the same connections. Sinusoidal excitation is applied for a few cycles of the wire oscillation. The wire is maintained in a continuously vibrating state. Excitation voltage varies automatically to maintain the desired return signal strength.
Thermistor Inputs
Each channel has two terminals for connecting to the thermistor. Both thermistor terminals are labeled T, and the polarity of the wiring is arbitrary. The measurement is a half-bridge configuration with the excitation circuitry and completion resistor integrated into the module.
Specifications
| -NOTE- | Electrical specifications are valid over a -40° to +70°C range, non-condensing environment, unless otherwise specified. Extended electrical specifications are valid over a -55° to +85°C range in a non-condensing environment. |
| Operating Temperature Range |
|
| Scan Rates | 20, 50, 100, 200,or 333 Hz (dependent upon the resonant frequency of the gages) |
| CPI Baud Rate | Selectable from 25 kbps to 1 Mbps |
| Input Resistance | 5 kΩ |
| Excitation Voltage Range | 0 to ±3 V (6 V peak-to-peak) |
| Excitation Voltage Resolution | 26 mV |
| Measurement Frequency Accuracy | ±(0.005% of reading + measurement resolution) |
| Sustained Input Voltage without Damage | -0.5 to +7.1 V |
| USB | USB 2.0 full speed connection is available for attaching the device to a PC. (This port is provided to configure the module, send updates, and communicate with the Dynamic Vibrating Wire Toolbox software. The USB port is not provided for use within a permanent data collection system.) |
| CPI | Used for connection to the data logger. Baud rate selectable from 50 kbps to 1 Mbps. (Allowable cable length varies depending on baud rate, number of nodes, cable quality, and noise environment, but can be as long as 2,500 ft under proper conditions.) |
| Mounting | Standard 1-in. grid (Optional DIN rail mounting available.) |
| Dimensions | 20.3 x 12.7 x 5.1 cm (8 x 5 x 2 in.) |
| Weight | 816.47 g (1.8 lb) |
Measurement Resolution at Sample Rates |
|
| -NOTE- | Typical values for a 2.5 kHz resonant sensor |
| 1 Hz Sample Rate | 0.005 Hz RMS (noise level) |
| 20 Hz Sample Rate | 0.008 Hz RMS (noise level) |
| 50 Hz Sample Rate | 0.015 Hz RMS (noise level) |
| 100 Hz Sample Rate | 0.035 Hz RMS (noise level) |
| 200 Hz Sample Rate | 0.11 Hz RMS (noise level) |
| 333.3 Hz Sample Rate | 0.45 Hz RMS (noise level) |
Sensor Resonant Frequency Range |
|
| 20 Hz Sample Rate |
|
| 50 Hz Sample Rate |
|
| 100 Hz Sample Rate |
|
Thermistor |
|
| Completion Resistor | 4.99 kΩ 0.1% |
| Excitation Voltage | 1.5 V |
| Resolution | 0.002 Ω RMS (@ 5 kΩ thermistor resistance) |
| Accuracy | 0.15% of reading (Thermistor accuracy and resistance of the wire should be considered as additional errors.) |
| Measurement Rate | 1 Hz |
Power Requirements |
|
| Voltage | 9.6 to 32 Vdc |
| Typical Current Drain | 190 mA (@ 12 Vdc) |
Compatibility
Note: The following shows notable compatibility information. It is not a comprehensive list of all compatible or incompatible products.
Data Loggers
| Product | Compatible | Note |
|---|---|---|
| CR1000X (retired) | Requires OS version 4 or greater. | |
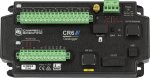
| CR6 | Requires OS version 10 or greater. | |
| Granite 9 | Requires OS version 1 or greater. |
Miscellaneous
| Product | Compatible | Note |
|---|---|---|
| Granite 10 | Requires OS version 1 or greater. | |
| Granite 6 (retired) | Requires OS version 1 or greater. |
Additional Compatibility Information
The VWire 305 is compatible with CPI-enabled data loggers only.


Downloads
DVW Tool Box v.1.3 (13.4 MB) 04-11-2019
DVW Tool Box is an application-specific software tool for demonstration and evaluation of the CDM-VW300, CDM-VW305 and VWire 305 dynamic vibrating wire interfaces.
VWire 305 OS v.6 (602 KB) 21-04-2020
Execution of this download installs the VWire 305 Operating System on your computer for upload to the VWire 305 device with Device Configuration Utility.
View Update HistoryVWire 305 program example v.1 (2 KB) 16-01-2020
Program to read 20 Hz dynamic data from two VWire 305 analyzers measuring eight channels each.
CPI Calculator v.1.0 (2.49 MB) 06-07-2016
The CPI Calculator is a downloadable Microsoft Excel spreadsheet used to estimate the usage and capacity of a CPI network. The calculator provides an overview on CPI devices including the CDM-A108, CDM-A116, CDM-VW300, CDM-VW305, and the CSAT3B. The calculator can also estimate the measurement speed of the CDM-A108 and CDM-A116 based on the number of channels and measurement parameters.
The CPI Calculator is an estimation tool and will help you better understand and design CPI networks by considering the following:
- What is the capability of each CDM or CPI device
- What is the CPI network capacity
- How much of the CPI capacity are the CDMs or CPI devices using
Case Studies
China is making strides in the global wind energy market, especially when it comes to......read more

In the intricacies of transportation networks, bridges take center stage, knitting together communities and ensuring......read more
Listed Under
Privacy Policy Update
We've updated our privacy policy. Learn More
Cookie Consent
Update your cookie preferences. Update Cookie Preferences